FPGA Lock-In Amp
Introduction
The objective of this document is to:
- The reader understands the main features of the Lock-In Amplifier. It is supposed that the reader has knowledge in VHDL and Digital Signal Processing.
- Reference the work produced related to the FPGA Lock-In Amplifier.
- Reference the Simulation files, and how the test are done to validate the system.
The source code referenced in this document is FaunaPhotonics Gitlab in the repository Lock In Amp - Volito3.
Requirements
The system requirements are:
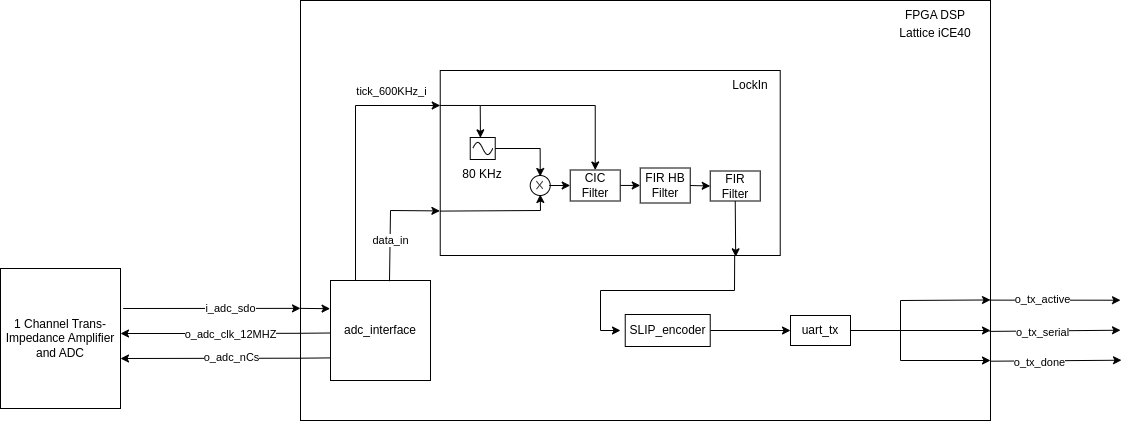
- Clock: The clock of the system is a 12 MHz clock. The reason for this is that the selected FPGA for prototyping is the Lattice iCEBreaker, and because is a resonable clock rate.
The filter requirements are:
- Bandwidth: 2.5 KHz
- Input Sample rate: 600 KHz. With a clock of 12 MHz, the output sample rate of the ADC is 600 KHz.
- Output Sampling Throughput: 6 KHz.
- Prioritize a low number of coefficients
- High gain, arround 260 dB at the output
Theory
Lock In Amp
20230329 - Lock-in amplifier theory
CIC Filter
FIR Filter
Architecture
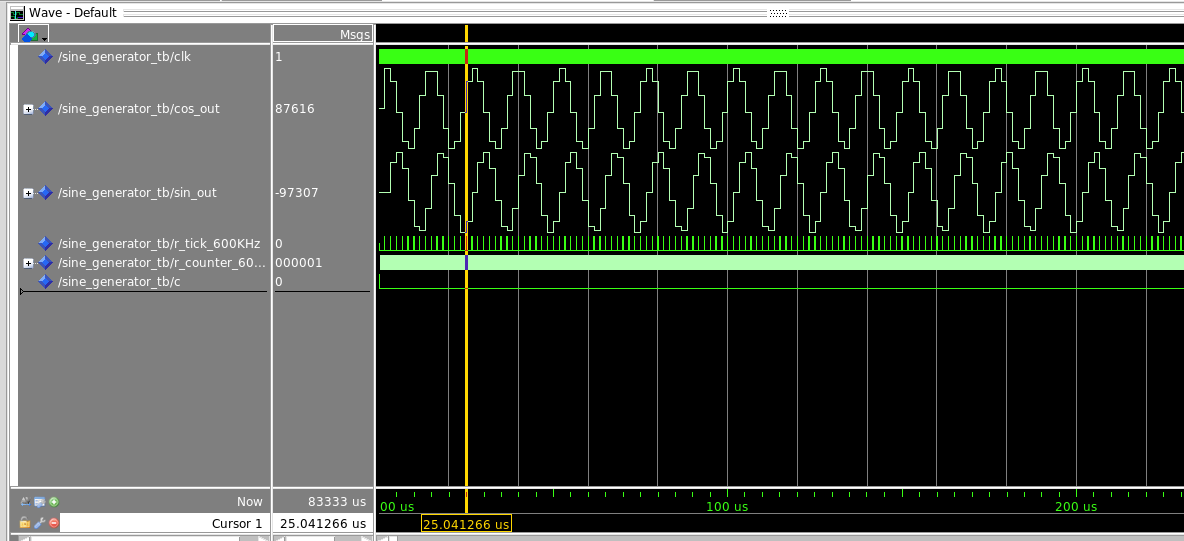
Sin Generator
- Source code lock-in-amp-volito3/hdl/sine_generator.vhd
- Simulation file lock-in-amp-volito3/test/sine_generator_tb.vhd
- Wave file (do) lock-in-amp-volito3/simulation/waves/sine_generator_tb.do
Some comments related to the code:
- tbl(i).cos: is a cos signal with frequency 2MHz/NUM_ENTRIES
- With cnt_step we are controlling the output frequency. For example NUM_ENTRIES 100, for a frenquency of 80KHz will be, 80KHz/(2MHz/100) = 4.
- The frequency of the sinus is: freq = (cnt_step / NUM_ENTRIES) * 2 MHz
The output of the simulation file:
Mixer – Mult Accumulation
- Source code lock-in-amp-volito3/hdl/mult_accum.vhd
- Simulation file lock-in-amp-volito3/test/mult_accum_tb.vhd
- Wave file (do) lock-in-amp-volito3/simulation/waves/mult_accum_tb.do
The multiplication truncate the result to have the most important bits, and discard the least significant bits. The output length of the result is (0 to a’length+b’length-1).
In the simulation file there are a bunch of tests to understand the mult accum.
CIC Filter
- Source code lock-in-amp-volito3/hdl/cic_decimator.vhd
- Simulation file: lock-in-amp-volito3/test/cic_filter_tb.vhd
- Matlab simulation filter response: lock-in-amp-volito3/simulation/scripts/volito3_filter_analysis.mlx
- Jupyterhub validation: lock-in-amp-volito3/simulation/scripts/CIC_Filter_test.ipynb
The CIC have been modeled on matlab using the DSP tooldbox, and also in python from a custom implementation. The filter has been tested using the jupyterhub notebook that import the output data generated by the fpga.
HB Filter
- Source code lock-in-amp-volito3/hdl/fir_filter.vhd
- Matlab simulation filter response: lock-in-amp-volito3/simulation/scripts/volito3_filter_analysis.mlx
- Simulation file: lock-in-amp-volito3/fir_filter_tb.vhd
- Jupyter verification: lock-in-amp-volito3/simulation/scripts/FIR_Filter_test.ipynb
The fir filter has been modeled using matlab, imposing the parameters of the filters and getting the coefficients. The fir filter is simulated using the jupyter script that creates a file with the data, then processed by the testbench and finally comparing the results with the python model.
The HB filter is a FIR filter with the coefficients of a half band filter. The simulation and verification are the same for both filters but chaning the coefficients.
FIR Filter
- Source code lock-in-amp-volito3/hdl/fir_filter.vhd
- Matlab simulation filter response: lock-in-amp-volito3/simulation/scripts/volito3_filter_analysis.mlx
- Simulation file: lock-in-amp-volito3/fir_filter_tb.vhd
- Jupyter verification: lock-in-amp-volito3/simulation/scripts/FIR_Filter_test.ipynb
ADC Interface
The adc_interface.vhd generates the nCs and clock signals for the adc, and receives the SPI communication with SPI_rx.vhd. The ADC is being simulared with main_tb.vhd that generates a simulated SPI signal.
SLIP Encoder
- Source code lock-in-amp-volito3/hdl/SLIP_encoder.vhd
- Simulation file:
test/SLIP_encoder_tb.vhd - Jupyter verification:
simulation/scripts/SLIP_encoder_test.ipynb
The i_data needs to be multiple of 8 bits.
UART TX
- Source code lock-in-amp-volito3/hdl/UART_TX.vhd
- Implementation to test UART TX with SLIP Encoder:
lock-in-amp-volito3/hdl/SLIP_UART_Counter.vhd - Python file for reception:
lock-in-amp-volito3/simulation/scripts/SLIP_UART_Counter_plot.py
A implementation was created to validate the UART interface alongside the SLIP Encoder. Basically it generates a counter, and you can receive the values on the python script. It is used to test the maximum baudrate and to check if it is a noisy UART channel.
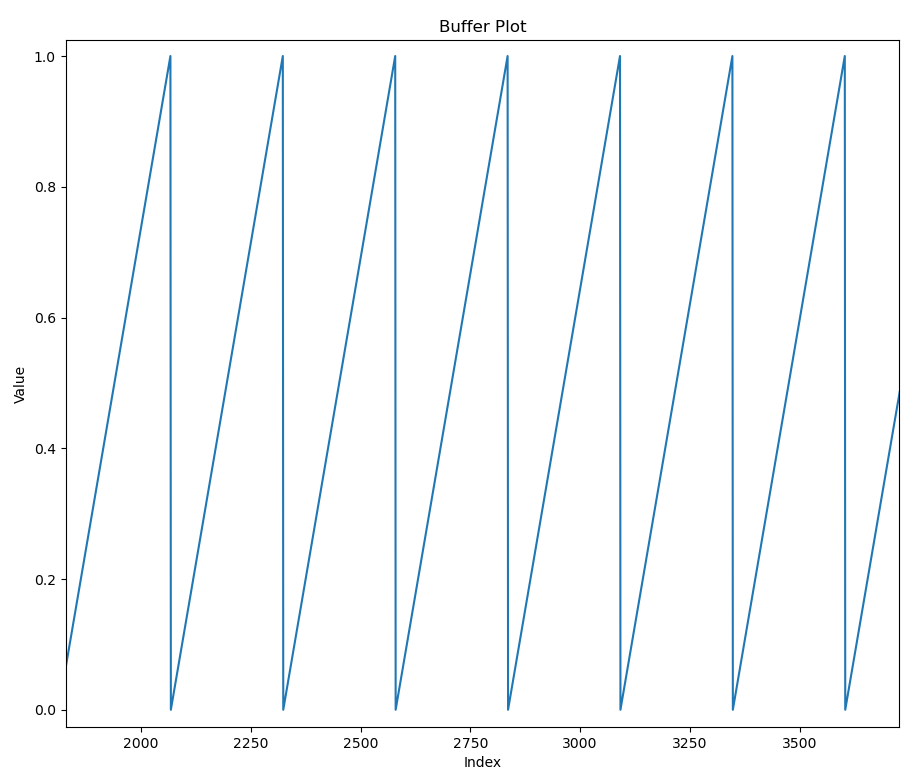
Running with a baudrate of 1 MBaud there is no errors on the channel.
Lock in
- Source code lock-in-amp-volito3/hdl/lock_in_amp.vhd
- Jupyter verification: lock-in-amp-volito3/simulation/scripts/LockInAmp-Volito3.ipynb
- Simulation file: lock-in-amp-volito3/test/lock_in_amp_tb.vhd
The Lock In amplifier is implemented via software by generating a signal and using a advance testbench. The results can be seen in the jupyter notebook. The comparison between the python implementatio and the vhdl implementation have the same results.
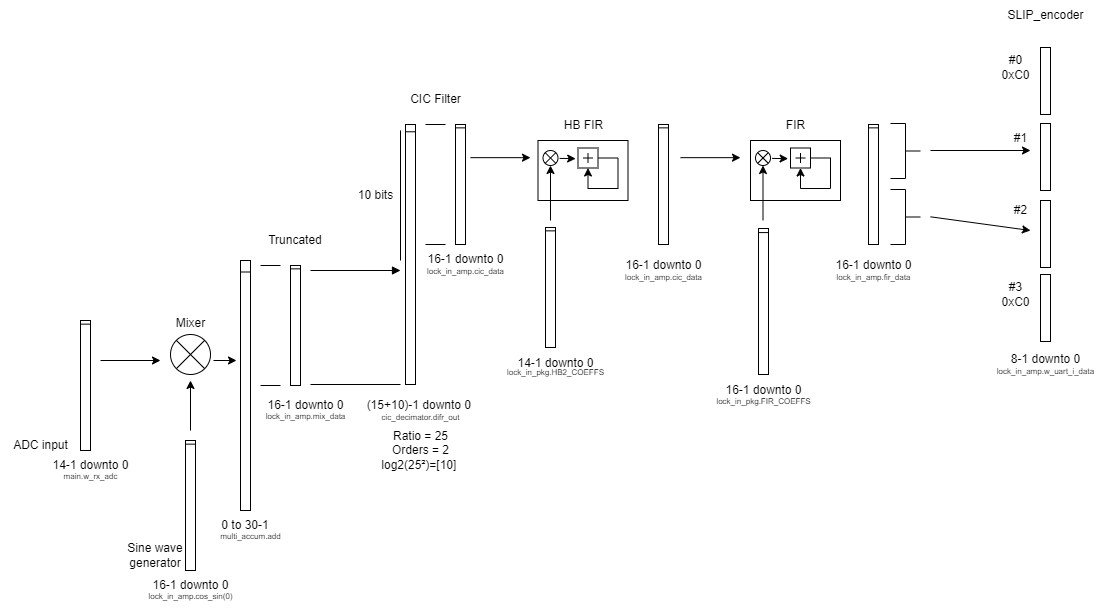
Filter flow
Frequency response
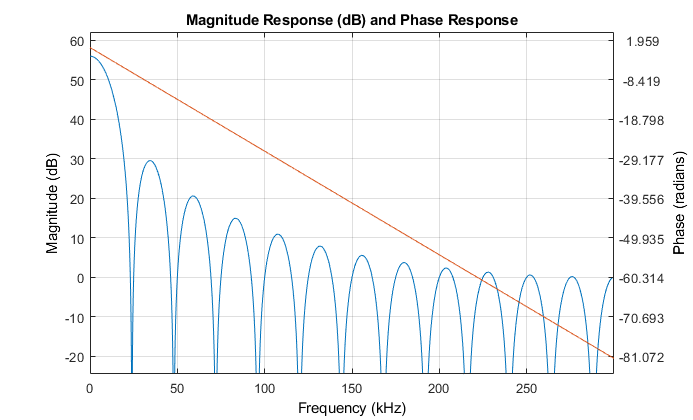
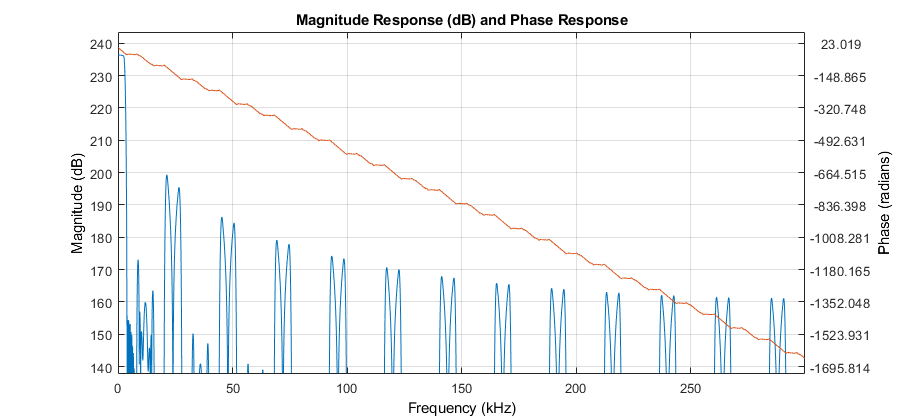
CIC Decimator
- Matlab simulation filter response: lock-in-amp-volito3/simulation/scripts/volito3_filter_analysis.mlx
Properties:
- Order: 2
- Ratio: 25
- Input Sample rate: 600KHz
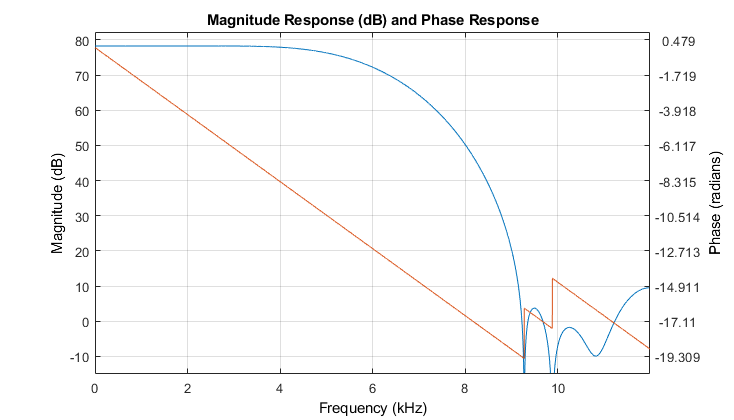
HB Filter
- Matlab simulation filter response: lock-in-amp-volito3/simulation/scripts/volito3_filter_analysis.mlx
Properties:
- Decimation: 2
- Input sample rate: 24KHz
- Filter order: 16
- Method used: Matlab function
dsp.FIRHalfbandDecimator
The coefficients of the filter are generated by the matlab simulation filter response.
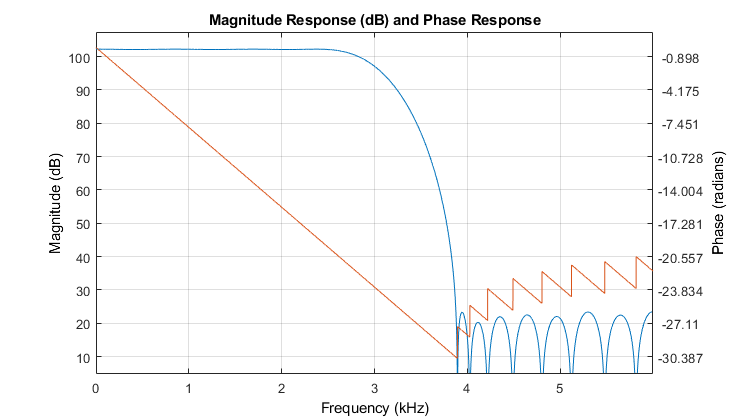
FIR Filter
- Matlab simulation filter response: lock-in-amp-volito3/simulation/scripts/volito3_filter_analysis.mlx
Properties:
- Decimation: 2
- Input sample rate: 12KHz
- Filter order: 30
- Band pass: 2.5KHz
- Pass band Ripple: 0.1 dB
- Method used: Matlab function
dsp.LowpassFilter
The coefficients of the filter are generated by the matlab simulation filter response.
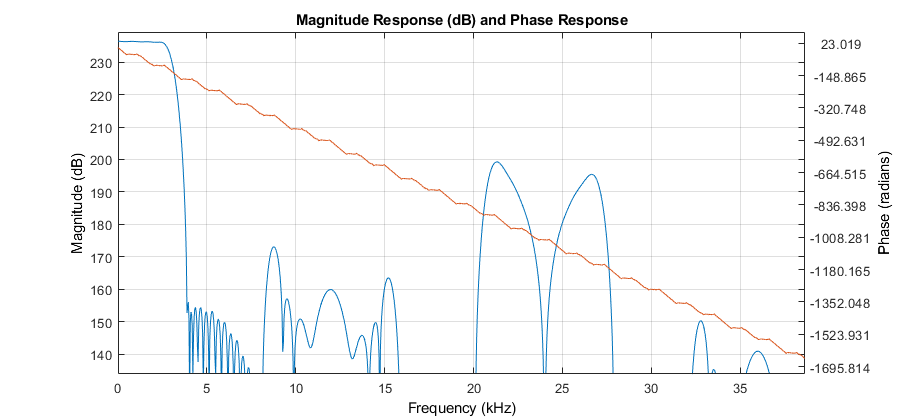
Cascaded output
- Matlab simulation filter response: lock-in-amp-volito3/simulation/scripts/volito3_filter_analysis.mlx
Data rate

Validation
TIA2UART
The file tia2uart.vhd implements the ADC interface, the SLIP encoder and the UART transmission. The script simulation/scripts/read_realtime.py connects to the serial and print the received SLIP packages. The system has been tested by connecting the output of the signal generated to the fpga and reading the serial output.
Validation of the LockIn
The hdl/main.vhd file implements all the LockInAmplifier.
Build process
TODO: Describe how to build the project
TODO: Talk about the warnings.
Testing setup
- Setup 12V at the power supply and connect it to the TIA2PMOD with the pins VIN and GND.
- Setup the signal generator with a 1.2 Vpp signal at 80KHz and offset 1.5V.
- Upload the bin file to the fpga, reset it by pressing button 1 and connect it to the TIA2PMOD
- Execute the python script
simulation/scripts/read_realtime.py.
Specifications
Constraints
Power usage
LUTS Usage
Known problems
- There is no CRC on the UART
- It is necessary to push reset button at start.